


Results
This chapter presents findings from descriptive analyzed of respondents’ demographic data and factors that influence people to use operating system. The hypothesis test and interview results are also presented as follows.
4.1 Personal Data of Respondents
Personal data of the respondents obtained from questionnaires was analyzed and presented in the following tables.
Table 4.1 Personal data
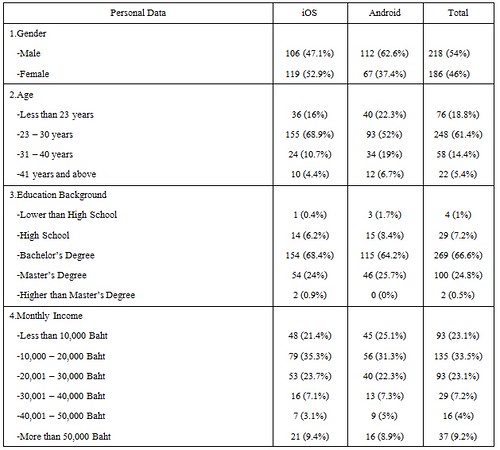
Findings from Table 4.1 revealed following:
1. Major group of iOS respondents’ gender were female (52.9%) and follows by male (47.1%) whereas major group of Android respondents’ gender were male (62.6%) and follows by female (37.4%).
2. Major group of iOS respondents’ age were 23-30 years (68.9%) follows by less than 23 years (16%), 31 – 40 years (10.7%), 41 years and above (4.4%) respectively. Major group of Android respondents’ age were 23-30 years (52%) follows by less than 23 years (22.3%), 31 – 40 years (19%), 41 years and above (6.7%) respectively.
3. Major group of iOS respondents’ education level were Bachelor’s Degree (68.4%), follows by Master’s Degree (24%), High School (6.2%), Higher than Master’s Degree (0.9%), Lower than High School (0.4%) respectively. Major group of Android respondents’ education level were Bachelor’s Degree (64.2%), follows by Master’s Degree (25.7%), High School (8.4%), Higher than Master’s Degree (1.7%), Lower than High School (0%) respectively.
4. Major group of iOS respondents’ income level were 10,000 – 20,000 baht (35.3%), follows by 20,001 – 30,000 baht (23.7%), Less than 10,000 baht (21.4%), 50,000 baht and above (9.4%), 30,001 – 40,000 baht (7.1%), 40,000 – 50,000 (3.1%) respectively. Major group of Android respondents’ income level were 10,000 – 20,000baht (31.3%), follows by Less than 10,000 baht (25.1%), 20,001 – 30,000 baht (22.3%), 50,000 baht and above (8.9%), 30,001 – 40,000 baht (7.3%), 40,000 – 50,000 (5%) respectively.
Table 4.2 Changing Operating system and reasons
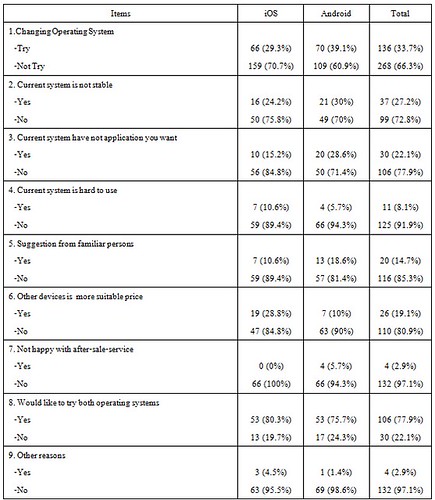
Findings from Table 4.2 revealed following:
1. Major group of iOS respondents’ changing operating system were not try (70.7%), follows by try (29.3%) and major group of Android respondents’ changing operating system were not try (60.9%), follow by try (39.1%).
2. iOS respondents would like to use Android because current system is not stable (24.2%), current system have not application you want (15.2%), current system is hard to use (10.6%), suggestion from familiar persons (10.6%), other devices is more suitable price (28.8%), would like to try both operating systems (80.3%) and other reasons (4.5%).
3. Android respondents would like to use iOS because current system is not stable (30%), current system have not application you want (28.6%), current system is hard to use (5.7%), suggestion from familiar persons (18.6%), other devices is more suitable price (10%), not happy with after-sale-service (5.7%), would like to try both operating systems (75.7%), and other reasons (1.4%).
4.2 Factors toward Decision to use operating system of Respondents
Interpretation of measurement result to measure level of variable according to the separate of five levels following Likert’s scale is shown in the following table.
Factors namely price, appearance, specification, application, stability, compatibility, after sale service, social influence and word of mouth effect were taken to test relationships with the Decision to use operating system. The results from descriptive statistic analyzing are summarized and shown in the following tables.
Table 4.3 Factors that Influence people to use iOS
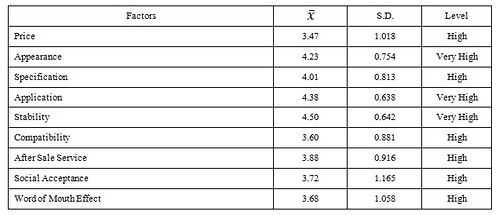
The interpretation of measurement result is 4.21 – 5.00 equals very high; 3.41 – 4.20 equals high; 2.61 – 3.40 equals moderate; 1.81 – 2.60 equals low; and 1.00 – 1.80 equals very low.
Findings from Table 4.3 revealed people’s opinion on factors toward decision to use iOS could be illustrated respectively as follows:
1. iOS users stated that they would like to consider about price when they decide to use iOS or Android at high level (𝑥 ̅= 3.47)
2. iOS users stated that they would like to consider about appearance when they decide to use iOS or Android at very high level (𝑥 ̅= 4.23)
3. iOS users stated that that they would like to consider about specification when they decide to use iOS or Android at high level (𝑥 ̅= 4.01)
4. iOS users stated that that they would like to consider about application when they decide to use iOS or Android at very high level (𝑥 ̅= 4.38)
5. iOS users stated that that they would like to consider about stability when they decide to use iOS or Android at very high level (𝑥 ̅= 4.50)
6. iOS users stated that that they would like to consider about compatibility when they decide to use iOS or Android at high level (𝑥 ̅= 3.60)
7. iOS users stated that that they would like to consider about after-sale-service when they decide to use iOS or Android at high level (𝑥 ̅= 3.88)
8. iOS users stated that that they would like to consider about social acceptance when they decide to use iOS or Android at high level (𝑥 ̅= 3.72)
9. iOS users stated that that they would like to consider about word-of-mouth effect when they decide to use iOS or Android at high level (𝑥 ̅= 3.68)
Table 4.4 Factors that Influence people to use Android
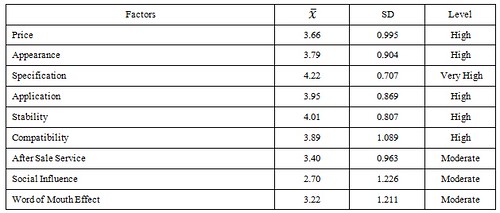
Findings from Table 4.4 revealed people’s opinion on factors toward decision to use iOS could be illustrated respectively as follows:
1. Android users stated that they would like to consider about price when they decide to use iOS or Android at high level (𝑥 ̅= 3.66)
2. Android users stated that they would like to consider about appearance when they decide to use iOS or Android at high level (𝑥 ̅= 3.79)
3. Android users stated that they would like to consider about specification when they decide to use iOS or Android at very high level (𝑥 ̅= 4.22)
4. Android users stated that iOS users stated that that they would like to consider about application when they decide to use iOS or Android at high level (𝑥 ̅= 3.95)
5. Android users stated that they would like to consider about stability when they decide to use iOS or Android at high level (𝑥 ̅= 4.01)
6. Android users stated that they would like to consider about compatibility when they decide to use iOS or Android at high level (𝑥 ̅= 3.89)
7. Android users stated that they would like to consider about after-sale-service when they decide to use iOS or Android at moderate level (𝑥 ̅= 3.40)
8. Android users stated that they would like to consider about social acceptance when they decide to use iOS or Android at moderate level (𝑥 ̅= 2.70)
9. Android users stated that they would like to consider about word-of-mouth effect when they decide to use iOS or Android at moderate level (𝑥 ̅= 3.22)
4.3 Test Hypotheses
This study employed chi square (�dc652) test and T - Test to test the hypotheses by testing relationships between user’s demographics and marketing factors that influencing decision to use operating system.
Table 4.5 The Relationship between demographic backgrounds of the users and their decisions to use operating system
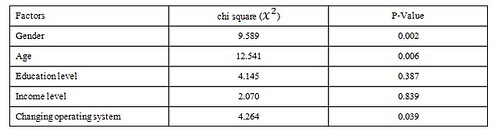
Findings from Table 4.5 illustrated as follow:
1. The results in relationship between gender and user’s decisions to use iOS and Android rejected the null Hypothesis 1 which stated there is no significant relationship between gender and user’s decisions to use iOS and Android.
2. The results in relationship between age and user’s decisions to use iOS and Android rejected the null Hypothesis 2 which stated there is no significant relationship between age and user’s decisions to use iOS and Android.
3. The results in relationship between education level and user’s decisions to use iOS and Android accepted the null Hypothesis 3 which stated there is no significant relationship between education level and user’s decisions to use iOS and Android.
4. The results in relationship between income level and user’s decisions to use iOS and Android accepted the null Hypothesis 4 which stated there is no significant relationship between income level and user’s decisions to use iOS and Android.
5. The results in relationship between changing operating system and user’s decisions to use iOS and Android rejected the null Hypothesis 5 which stated there is no significant relationship between changing operating system and user’s decisions to use iOS and Android.
Table 4.6 Comparison of iOS users and Android users in each factor
Findings from Table 4.6 illustrated as follow;
1. The result accepted the null Hypothesis 6 which stated there is no significant relationship between price and decision to use iOS or Android.
2. The result rejected the null Hypothesis 7 which stated there is no significant relationship between appearance and decision to use iOS or Android.
3. The result rejected the null Hypothesis 8 which stated there is no significant relationship between specification and decision to use iOS or Android.
4. The result rejected the null Hypothesis 9 which stated there is no significant relationship between application and decision to use iOS or Android.
5. The result rejected the null Hypothesis 10 which stated there is no significant relationship between stability and decision to use iOS or Android.
6. The result rejected the null Hypothesis 11 which stated there is no significant relationship between compatiability and decision to use iOS or Android.
7. The result rejected the null Hypothesis 12 which stated there is no significant relationship between after-sale-service and decision to use iOS or Android.
8. The result rejected the null Hypothesis 13 which stated there is no significant relationship between social acceptance and decision to use iOS or Android.
9. The result rejected the null Hypothesis 14 which stated there is no significant relationship between word-of-mouth effect and decision to use iOS or Android.
4.4 The results obtain from interview (see question details in Appendix C)
Figure 4.1 The interview from 2 companies using mobile application for marketing channel
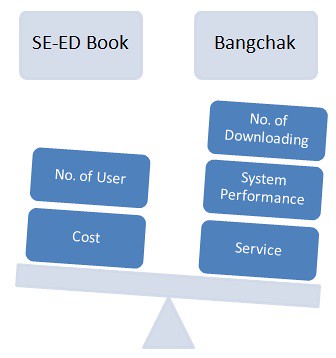
Finding from table 4.6 illustrated that there was a different in factor influencing companies to choose operating system for develop application. Bangchak which chose iOS before Android has 3 factors namely number of downloading, system performance (stability) and service. SE-ED Book, however, which chose Android before iOS has 2 factors namely number of operating system user and cost of developing.
4.4.1 Result of interviewing from application developers
Table 4.6 Result of interviewing from application developers
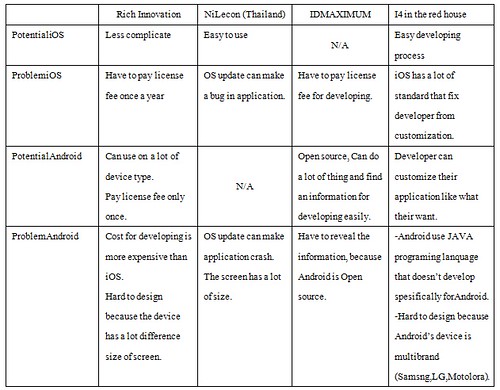
From the table above, we can conclude that iOS potential is easy to develop but developer has to pay licensce fee once a years and when iOS updates,It can crate a bug in application. The potential of Android is Developing device that can use a lot of diferrence type. The developer has to pay license fee only once, but the cost for developing is more expensive. When the OS is update the old version application can’t be used. The potential of android is developer has to pay license fee only once and easily to find an information for developing easy to find, but because Android is an Open source, so the developer has to reveal their information and device has a difference size of screen. It cause the designing to be more complicate than iOS.